Device reports
This report shows general overview of what has been done on all devices in the company during the specified period. Then you can filter the results and view them based on Users, Departments, Devices, Locations and documents. You can also export the results to CSV and Excel sheet.
Filters Section
Located at the top of the dashboard, the filters allow users to customize the data view:
Date Range: Select the period for which operations data should be displayed (e.g., 2025-10-14 to 2025-10-21).
User: Filter data by individual users.
Department: Narrow down results by department.
Device: Choose specific devices to analyze their usage.
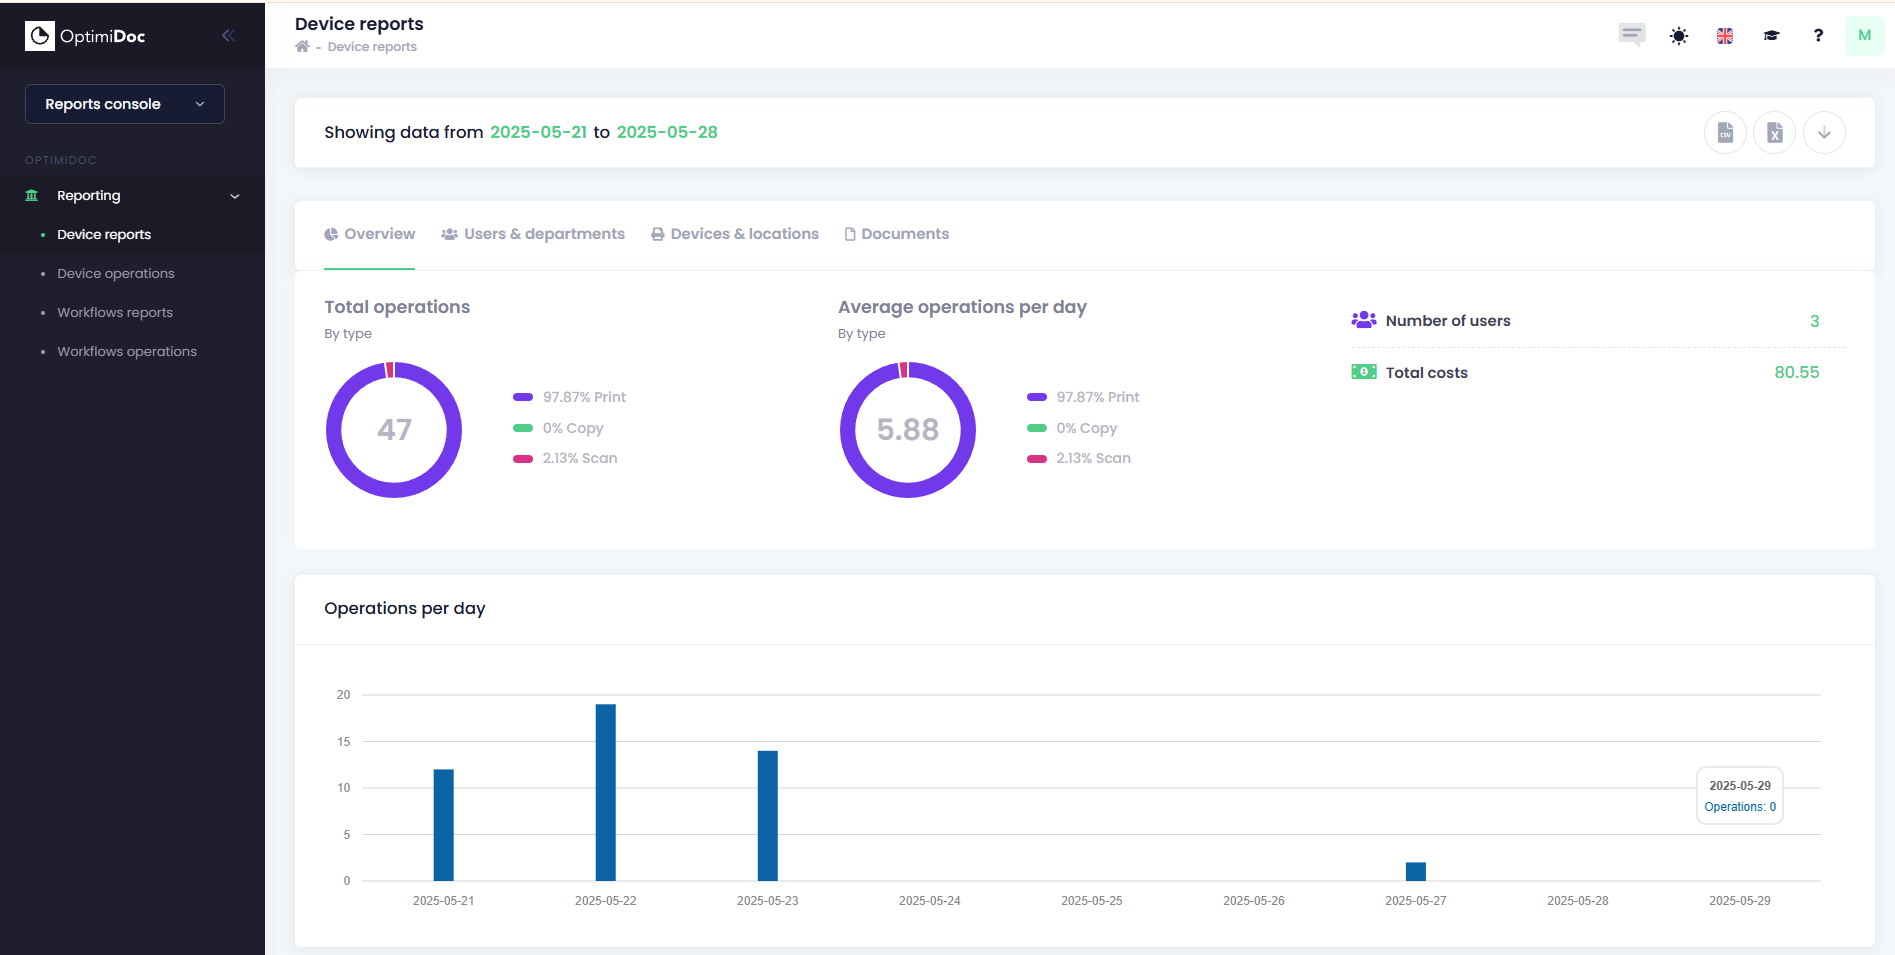
Overview
This dashboard provides a visual summary of operations data over a selected date range. It is designed to help users monitor and analyze usage patterns across printing, scanning, and copying activities.
Total Operations
This section displays the overall count and distribution of operations during the selected period.
Visualization: Pie chart showing the percentage distribution of each operation type.
Average Operations Per Day
This section provides insights into daily usage averages.
Visualization: Pie chart identical to the total operations breakdown.
Additional Metrics
Number of Users: x
Total Costs: indicating cost during the selected period
Printing: Full Color vs Black & White Job Pages
Location: Left section of the dashboard
Visualization: Pie chart showing the proportion of color vs black & white pages.
Printing: Full Color vs Black & White Job Costs
Location: Right section of the dashboard
Purpose: Intended to show cost distribution between full color and black & white printing jobs.
Top 10 by Price
Location: Bottom section of the dashboard
This list ranks users based on the cost of their printing jobs.
Users & Departments Report
This tab provides detailed insights into individual user and departmental activity related to printing, scanning, and copying. It is designed to support usage tracking, cost analysis, and operational optimization.
Summary Metrics (Top Section)
Each metric represents an average or total value across all users:
- Total Users: The number of unique users included in the report.
- Prints/User: Average number of print jobs per user.
- Total Costs/User: Average cost incurred per user for all operations.
- Total Pages/User: Average number of pages processed per user.
- Duplex Percentage: Percentage of pages printed using duplex (double-sided) mode.
- Copies/User: Average number of copy jobs per user.
- Color Costs/User: Average cost of color printing per user.
- Color Pages/User: Average number of color pages printed per user.
- Color Percentage: Percentage of total printed pages that were in color.
- Scans/User: Average number of scanned pages per user.
- Black & White Costs/User: Average cost of black & white printing per user.
- Black & White Pages/User: Average number of black & white pages printed per user.
User Report Table
This table provides user-level breakdowns of activity:
- Given Name: User’s first name.
- Family Name: User’s last name.
- Department: The department the user belongs to.
- Color Pages: Number of color pages printed by the user.
- B&W Pages: Number of black & white pages printed by the user.
- Paper Sheets: Total number of physical sheets used (accounts for duplex printing).
- Scan: Number of pages scanned by the user.
- Costs: Total cost incurred by the user for all operations.
Department Report (Bottom Section)
This section summarizes activity at the department level. It typically includes:
- Color Pages: Number of color pages printed by the user.
- B&W Pages: Number of black & white pages printed by the user.
- Paper Sheets: Total number of physical sheets used (accounts for duplex printing).
- Scan: Number of pages scanned by the user.
- Costs: Total cost incurred by the user for all operations.
Devices & Locations Report
This tab provides detailed insights into device-level and location-based printing and scanning activities. It helps organizations monitor device performance, usage patterns, and optimize resource allocation.
Summary Metrics (Top Section)
Each metric represents an average or total value across all devices:
- Total Devices: The number of devices included in the report.
- Prints/Device: Average number of print jobs per device.
- Total Costs/Device: Average cost incurred per device for all operations.
- Total Pages/Device: Average number of pages processed per device.
- Duplex Percentage: Percentage of pages printed using duplex (double-sided) mode.
- Copies/Device: Average number of copy jobs per device.
- Color Costs/Device: Average cost of color printing per device.
- Color Pages/Device: Average number of color pages printed per device.
- Color Percentage: Percentage of total printed pages that were in color.
- Scans/Device: Average number of scanned pages per device.
- Black & White Costs/Device: Average cost of black & white printing per device.
- Black & White Pages/Device: Average number of black & white pages printed per device.
Device Report Table
This table lists individual device activity and specifications:
- Serial: Unique serial number identifying the device.
- Model: The model name or number of the device.
- Name: Assigned name for the device (for easy identification).
- Location: Physical location where the device is installed.
- Color Pages: Number of color pages printed by the device.
- B&W Pages: Number of black & white pages printed by the device.
- Paper Sheets: Total number of physical sheets used (accounts for duplex printing).
- Scan: Number of pages scanned by the device.
- Costs: Total cost incurred by the device for all operations.
Device Report by Location
This section summarizes activity based on location:
- Location: The physical site or department where devices are located.
- Color Pages: Total color pages printed at the location.
- B&W Pages: Total black & white pages printed at the location.
- Paper Sheets: Total sheets used at the location.
- Scan: Total number of scanned pages at the location.
- Costs: Total cost incurred for all operations at the location.
Documents Report
This section provides detailed insights into document-level printing and scanning activities. It helps track job sizes, analyze usage patterns, and monitor costs associated with individual print or scan jobs.
Summary Metrics (Top Section)
- Pages to Job Size: Visual representation of how total printed pages are distributed across different job size ranges (e.g., 1–5 pages, 6–10 pages, etc.).
- Jobs to Job Size: Shows the percentage of print jobs falling into various size categories.
- Total Documents Printed: The total number of documents processed during the selected period.
- Average Print Job Pages Count: The average number of pages per print job.
- Average Print Job Price: The average cost per print job.
Top 10 Documents Table
This table lists the most significant documents based on volume or cost:
- Job Title: The name or identifier of the print or scan job.
- User: The individual who initiated the job.
- Total Pages: The total number of pages included in the job.
- Color Pages: Number of color pages in the job.
- B&W Pages: Number of black & white pages in the job.
- Paper Sheets: Physical sheets used (accounts for duplex printing).
- Scan: Number of scanned pages associated with the job.
- Costs: Total cost incurred for the job.