Workflow reports
This report shows general overview of workflows used during the specified period. Then you can filter the results based on the available filters. You can also export the results to CSV and Excel sheet.
Filters
Located at the top of the section, filters allow customization of the displayed data:
- Date Range: Select the start and end dates for the report.
- User: Filter workflows by specific users.
- Department: Narrow down results to a particular department.
- Workflow: Choose specific workflows to view their activity.
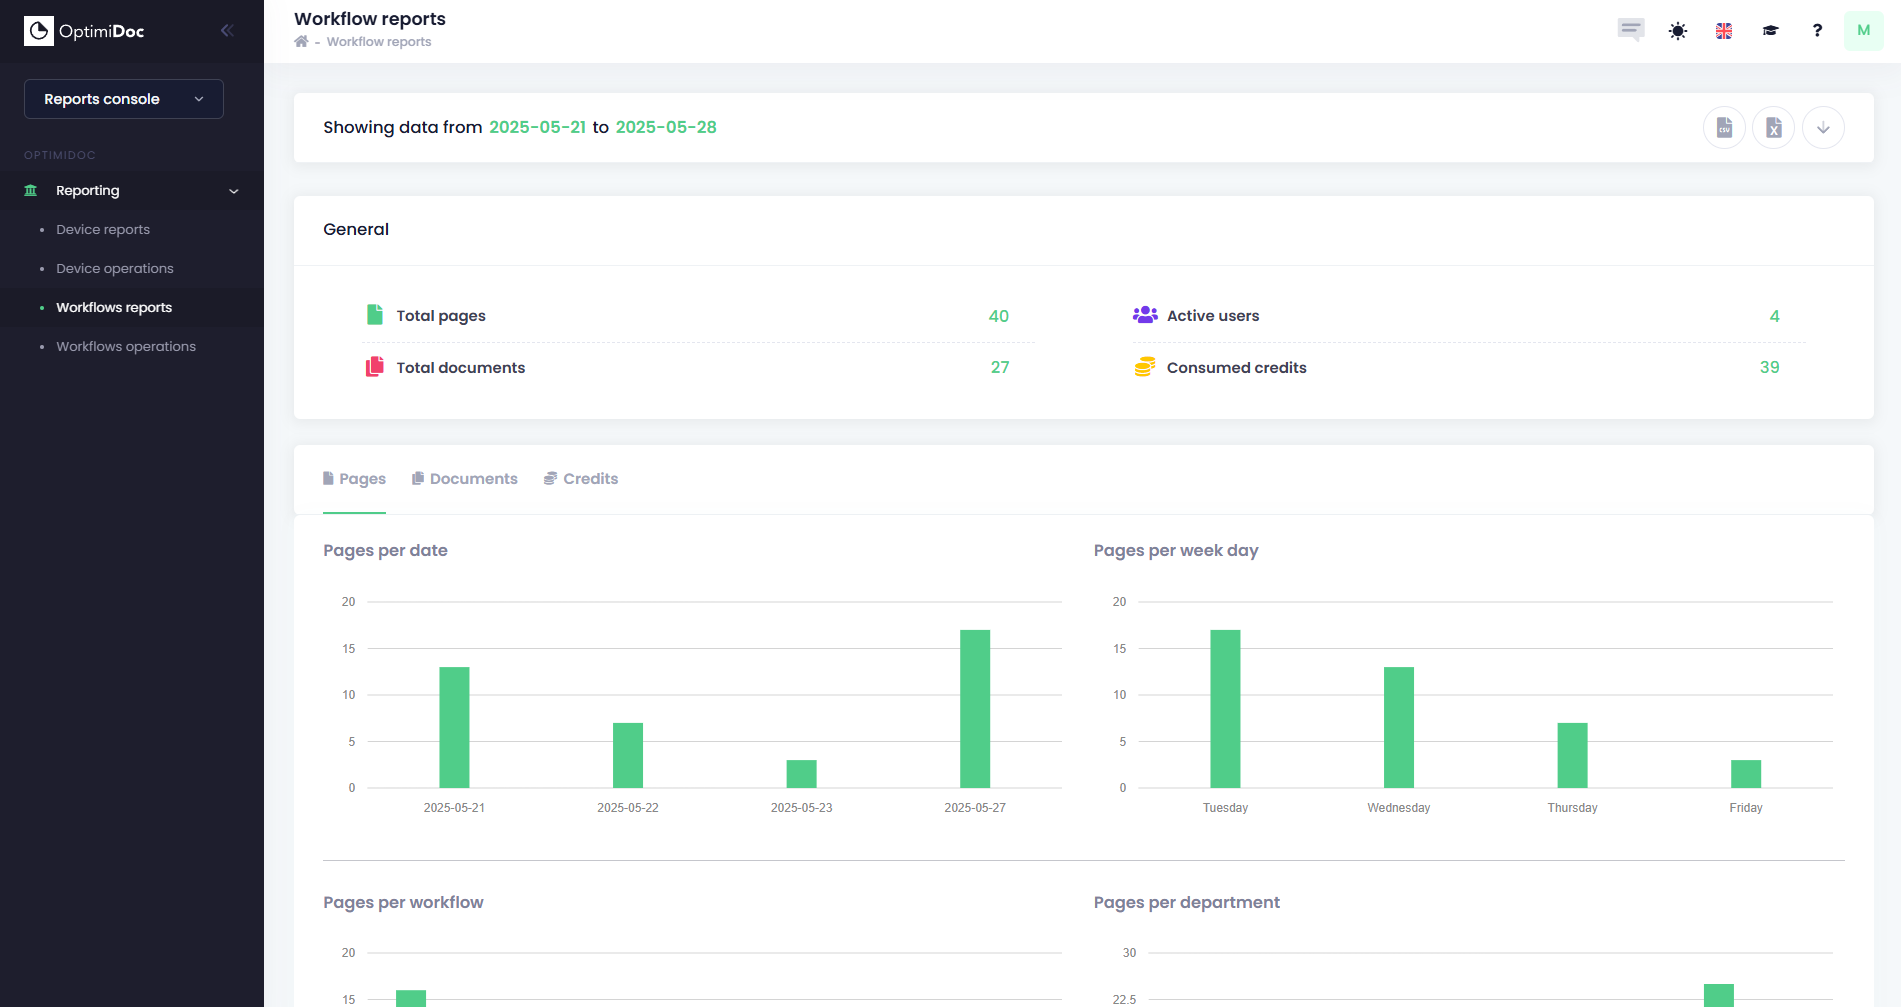
General Summary (Top Section)
This section displays high-level metrics:
- Total Pages: The total number of pages processed across all workflows.
- Total Documents: The total number of documents handled.
- Active Users: The number of users who executed workflows during the selected period.
- Consumed Credits: The number of credits used for workflow operations.
Workflow Reports – Pages
Overview
The Pages tab provides a detailed breakdown of page usage within workflows. It helps organizations analyze document processing trends by date, workflow type, department, and output format.
Charts and Visualizations
Pages per Date
- Shows the distribution of processed pages by specific dates within the selected range.
Pages per Work Day
- Displays page counts grouped by weekdays to identify peak activity days.
Pages per Workflow
- Breaks down page usage by workflow type (e.g., Scan to PDF, Scan to Word).
Pages per Department
- Shows how many pages were processed by each department.
Pages per Output Type
- Pie chart illustrating the percentage of pages by output format (e.g., Microsoft Word, Searchable PDF).
Pages per Destination
- Pie chart showing the distribution of pages by destination type (e.g., Email, Folder).
Pages per Source
- Pie chart indicating the origin of documents (e.g., MFP, uploaded file).
Workflow Reports – Documents Tab
Overview
The Documents tab provides insights into document-level activity within workflows. It helps organizations analyze how documents are processed by date, workflow type, department, and output format.
Charts and Visualizations
Documents per Date
- Displays the number of documents processed on each date within the selected range.
Documents per Week Day
- Shows document counts grouped by weekdays to identify peak processing days.
Documents per Workflow
- Breaks down document usage by workflow type (e.g., Scan to PDF, Scan to Word).
Documents per Department
- Indicates how many documents were processed by each department.
Documents per Output Type
- Pie chart illustrating the percentage of documents by output format (e.g., Microsoft Word, Non-searchable PDF, Searchable PDF).
Documents per Destination
- Pie chart showing the distribution of documents by destination type (e.g., Email, Folder).
Documents per Source
- Pie chart indicating the origin of documents (e.g., MFP, uploaded file).
Workflow Reports – Credits Tab
Overview
The Credits tab provides insights into credit consumption across workflows. It helps organizations monitor resource usage, track workflow costs, and optimize credit allocation.
Charts and Visualizations
Credits per Date
- Displays the number of credits consumed on each date within the selected range.
Credits per Week Day
- Shows credit usage grouped by weekdays to identify peak consumption days.
Credits per Workflow
- Breaks down credit consumption by workflow type (e.g., Scan to PDF, Convert to Word).
Credits per Department
- Indicates how many credits were used by each department.
Credits per Output Type
- Pie chart illustrating the percentage of credits consumed by output format (e.g., Microsoft Word, Excel, Searchable PDF).
Credits per Destination
- Pie chart showing the distribution of credits by destination type (e.g., Email, SharePoint Online, OneDrive Business).
Credits per Source
- Pie chart indicating the origin of documents (e.g., MFP, WebTools, Mobile).